When is the Right Time to Invest in the Stock Market
Written by Steve Karsh
Recent tariff talk has caused elevated volatility in the U.S. stock market. Despite the wild ride, however, markets are back to reaching new all-time highs. As financial advisors, we are often asked the following questions:
1) Is now a good time to invest in the market?
Our initial response to that question to ask a related question: What is your time frame?
If you have a long-term time horizon, the answer is that it’s always a good time to invest.
The chart shows bull and bear markets since 1942, and the data is overwhelmingly positive:
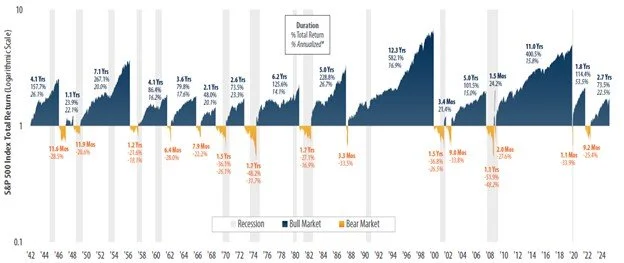
Source: First Trust- See notes (1)
Some key takeaways:
1. The average bull market lasted a little more than four years.
2. The average bear market lasted just 11 months.
3. The average cumulative GAIN for each bull market is close to +150%.
4. The average cumulative LOSS for each Bear Market is close to -32%.
5. Bull markets have historically lasted 4x longer than bear markets.
6. The longest bull market lasted 12 years.
7. The longest bear market lasted less than 2 years.
8. The largest GAIN in a bull market was +582%.
9. The largest LOSS in a bear market was -52%.
2) “The markets are making new highs, should I wait until they come down?”
Intuitively, one may think that to be a prudent strategy, but as the data below shows, this is NOT the case.
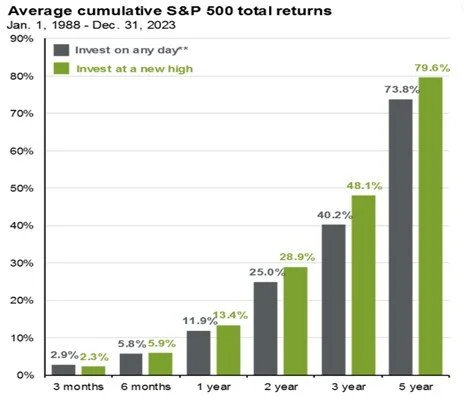
Source: JP Morgan - See notes (2)
For all time-periods of at least a year, investing after the market has made a new high has resulted in BETTER performance.
3) “Although we may not be in a recession, I currently don’t have much faith in the economy. Why should I invest in the market right now?”
Sometimes we allow our personal financial situation to sway our opinion on the overall economy, looking forward. Common sense would tell you not to invest in the market if you don’t feel good about the future. However, the data suggests you should remain invested, as the opposite is true:
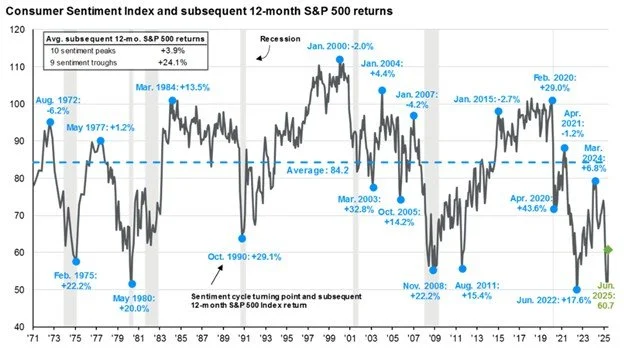
Source: JP Morgan - See notes (3)
Although it’s counterintuitive, when consumer confidence is at its lowest, forward one-year stock market returns have been much better (+24%) than when consumer confidence is at a peak (+3.9%).
4) “But why should I invest if it seems as if a recession coming?”
All the tariff talk and the actual implementation of tariffs, in some cases, has led many to believe a recession is imminent. Whether or not we experience a recession should have little bearing on investing in the stock market. When it comes to recessions, the problem is that we never really know when the economy has gone into one until we’re already actually in it. The data below sheds some light on investing before, during, and after a recession:
PERFORMANCE BEFORE, DURING, AND AFTER A RECESSION
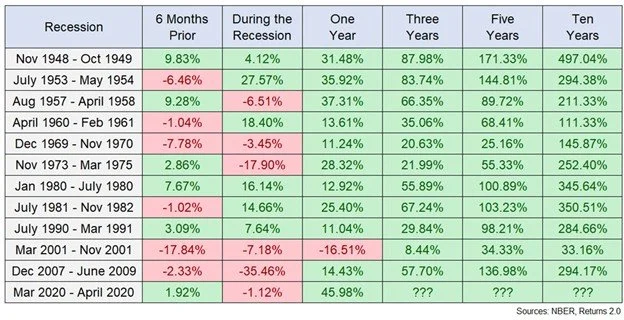
Source: A Wealth of Common Sense - See Notes (4)
Over the past 12 recessions, since 1948, the market has averaged a 1.4% return during a recession. If one was afraid to invest because of the recession, it’s likely they missed out of some healthy double digit returns generated after the recession, as the three-and five-year performance has historically been very strong: none of these instances saw a negative return.
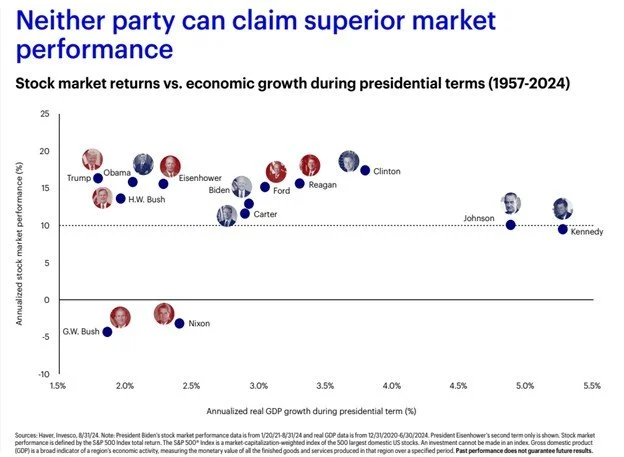
5) “But what about wars, other geopolitical events, and elections?”
All seem like credible excuses or reasons NOT to invest, but, once again, the data indicates otherwise:
The average annual total return of the S&P 500 Index for the period shown below was 10.94%.
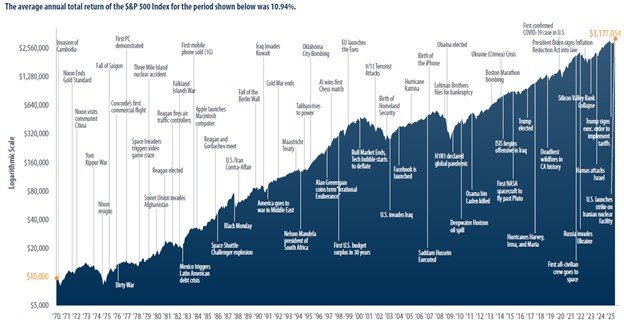
Source: First Trust - See notes (5)
Despite a plethora of what, on the surface, appear to be negative events, a $10,000 investment in the S&P 500 in 1970 would be over $3 million today! Throughout a long history of politics and elections, markets have shown that, regardless of party or political split, market performance remains strong irrespective of the political winds or changes in power.
To Invest or Not Invest?
An old saying in the investment business says, “It’s not about timing the market, but time in the market.” There isn’t a bad time to invest in the stock market if you have a long-term time horizon. History doesn’t always repeat itself and past performance is no guarantee of future results. That being said, no matter when you decide to invest, having a steady allocation to stocks in a diversified portfolio should give you the best shot at meeting your long-term investment objectives.
Notes
1. Source: First Trust, Bloomberg. Daily returns from 4/29/1942 – 9/30/2024. *No annualized return shown if duration is less than one year. Past performance is no guarantee of future results. These results are based on daily returns–returns using different periods would produce different results. The S&P 500 Index is an unmanaged index of 500 companies used to measure large-cap U.S. stock market performance. Investors ¬cannot invest directly in an index. Index returns do not reflect any fees, expenses, or sales charges. This chart is for illustrative purposes only and not indicative of any actual investment. These returns were the result of certain market factors and events which may not be repeated in the future.
The information presented is not intended to constitute an investment recommendation for, or advice to, any specific person. By providing this information, First Trust is not undertaking to give advice in any fiduciary capacity within the meaning of ERISA, the Internal Revenue Code or any other regulatory framework. Financial professionals are responsible for evaluating investment risks
independently and for exercising independent judgment in determining whether investments are appropriate for their clients.
2. Source: JP Morgan Guide to the Markets **”Invest on any day” represents average of forward returns for the entire time period whereas, “Invest at a new high,” represents average of rolling forward returns calculated from each new S&P 500 high for the subsequent 3-months, 6-months, 1-year, 2-year and 3-year intervals, with data starting 1/1/1988 through 12/31/2023.
3. Source: JP Morgan; FactSet, Standard & Poor’s, University of Michigan, J.P. Morgan Asset Management. Peak is defined as the highest index value before a series of lower lows, while a trough is defined as the lowest index value before a series of higher highs. Subsequent 12-month S&P 500 returns are price returns only starting from the end of the month and excluding dividends. Past performance is not a reliable indicator of current and future results. Guide to the Markets – U.S. Data are as of September 30, 2024.
4. Source: Ben Carlson – A Wealth of Common Sense. The NBER’s traditional definition of a recession is that it is a significant decline in economic activity that is spread across the economy and that lasts more than a few months. The committee’s view is that while each of the three criteria—depth, diffusion, and duration—needs to be met individually to some degree, extreme conditions revealed by one criterion may partially offset weaker indications from another. For example, in the case of the February 2020 peak in economic activity, we concluded that the drop inactivity had been so great and so widely diffused throughout the economy that the downturn should be classified as a recession even if it proved to be quite brief. The committee subsequently determined that the trough occurred two months after the peak, in April 2020.
5. Source: First Trust, Bloomberg. Data from 12/31/1969 – 3/31/2025. Past performance is no guarantee of future results. This chart is for illustrative purposes only and not indicative of any actual investment. The S&P 500 Index is an unmanaged index of 500 companies used to measure large-cap U.S. stock market performance. Investors cannot invest directly in an index. Index returns do not reflect any fees, expenses, or sales charges. Stocks are not guaranteed and have been more volatile than the other asset classes. These returns were the result of certain market factors and events which may not be repeated in the future. The information presented is not intended to constitute an investment recommendation for, or advice to, any specific person. By providing this information, First Trust is not undertaking to give advice in any fiduciary capacity within the meaning of ERISA, the Internal Revenue Code or any other regulatory framework. Financial professionals are responsible for evaluating investment risks independently and for exercising independent judgment in determining whether investments are appropriate for their clients.