

Anatomy of the Private Credit Market

Written by Wyck Brown CFA, MBA and Taylor Truitt
Introduction
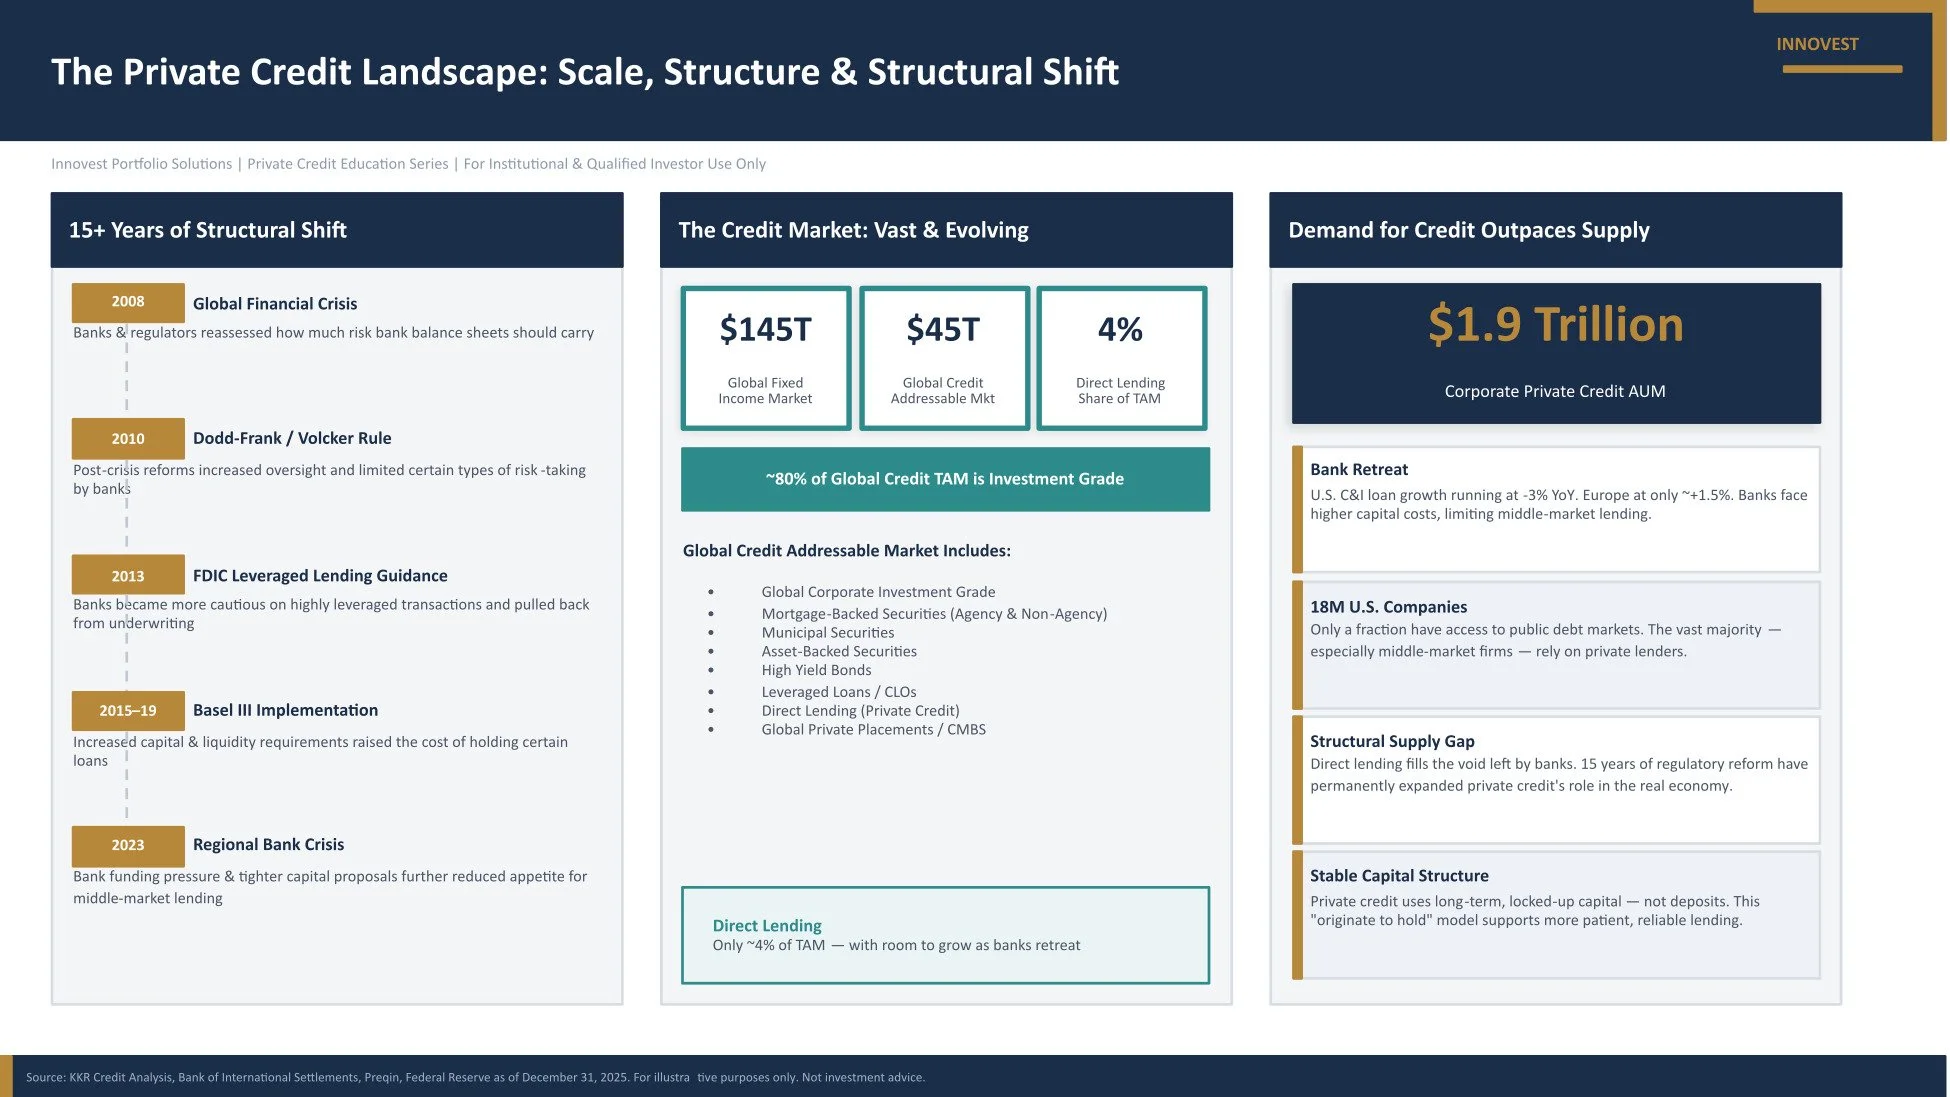
Private credit refers to debt extended to companies by non-bank entities, such as private equity firms and alternative asset managers. This space offers floating-rate, senior secured loans that are not publicly traded. Due in large part to new banking regulations that came about as a result of the GFC, Private Credit has been rapidly replacing traditional banks as the primary lender in the market and created a crucial financing source for mid-sized firms. Investors lean towards private credit because it provides high yields and floating rates in a rising-rate environment. However, it has also stirred concerns about borrower stress, loan transparency, and potential risks to the broader financial system.
Historical Context
Corporate credit has evolved throughout history from bespoke bank-held indentures to a diverse ecosystem of tradable and private obligations. Today, the market is primarily split between the Broadly Syndicated Loans (BSL) – large, liquid, enterprise-scale corporate debt – and Direct Lending, which involves privately negotiated loans to mid-sized companies.
Before the 2000s, private lending primarily took form in indentures and private placements. Business Development Companies (BDC) were created by Congress with the Small Business Investment Incentive Act of 1980 to help small and middle-market businesses who were struggling to access debt and equity capital following the 1970s recession.
Before 2008, traditional bank lending dominated the market and “Broadly Syndicated Loans” or BSLs became the dominant form of bank lending with loans often sold and pooled into CLOs. However, when the Great Financial Crisis (GFC) hit in 2007-2008, this asset class had major price disruptions with prices dropping precipitously as liquidity tightened among mass selloffs. Broadly syndicated loan (BSL) prices experienced a historic collapse at this time due to a massive deleveraging cycle and the forced liquidation of several credit-based hedge funds. Post GFC, there was a major shift in regulation surrounding lending. As banks faced more capital requirements, regulation, and scrutiny, banks retreated from the private credit market, making room for private, non-bank lenders who raised capital from long-term oriented investors as opposed to funding with short-term deposits as banks did. Private credit grew even more rapidly during the COVID-19 pandemic, as firms needed rapid, reliable financing. Direct lending through non-bank lenders has risen to fill a void left by the heavily regulated banking industry, and today, private credit has become a $1.72 trillion asset class.
Private Credit differs from traditional public debt markets in operation, liquidity, and regulation. Public debt, like bonds, is traded on public exchanges and has higher liquidity, stricter regulation, and standardized terms. Private debt/credit consists of loans negotiated directly between non-bank lenders and borrowers that can offer higher yields and customized terms with lower liquidity and transparency.
Key Features of Private Credit - Individual Private Credit Loan
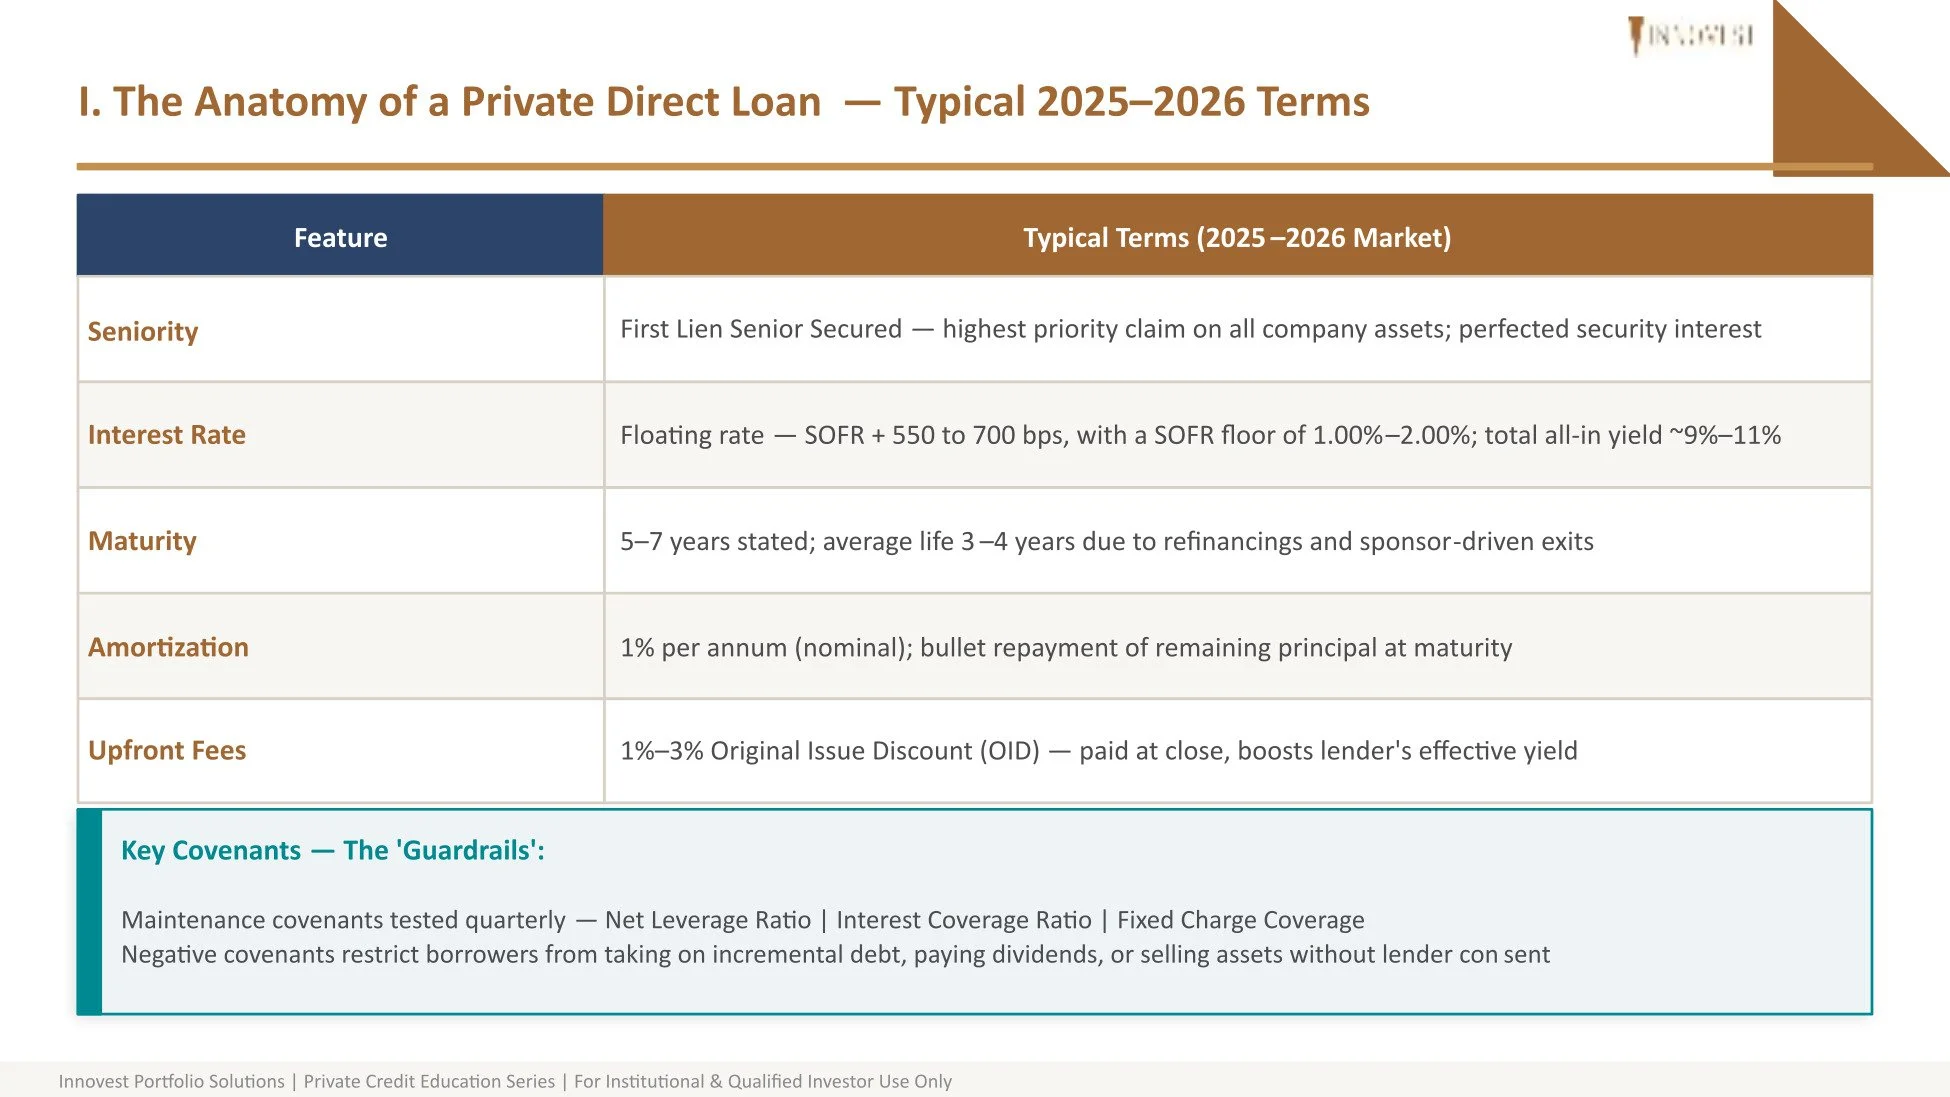
Modern private credit loans contain meaningful protective measures for investors as the vast majority are first lien senior secured, purchased to own for the long term (as opposed to selling upon origination like the BSL and MBS markets), originated by established credit managers with years of experience and large teams of credit professionals that understand risk and valuation. Additionally, these loans have strict covenant language in their documents and have experience historically high recovery rates upon default relative to other corporate debt instruments. Their high interest margins help overall portfolio cashflow offset any loss occasional single name defaults.
Economics of Private Credit
Private credit has distinctly emerged in the lending market because it provides customized financing solutions outside of the traditional banking system. Borrowers use private credit as a way for middle-market firms to source capital without the regulatory and minimum constraints of traditional bank lending. Private credit tends to be preferred when borrowers need speed, certainty of execution, and specialized terms that can be tailored to their risk profile.
Investors are made up of institutions such as insurance companies, credit funds, hedge funds, BDCs, etc. who are interested in high yields, downside protection, and control that are not usually available in public markets. However, there is a wide gap of about 13 percentage points between top and bottom performers due to differentiated underwriting skills, portfolio construction differences, and changing economic conditions, making manager selection critical.
This dynamic plays out in pricing. Loan spreads are driven by risk, illiquidity, and complexity and influenced by interest rates, underwriting, and negotiation power of lenders. Fees for private credit investors typically follow a “1 and 10 to 20” structure where there is a 1-2% annual management fee on committed capital, plus 10-20% of profits if a hurdle rate is achieved. These fees are justified by an illiquidity premium, lower volatility, and superior returns provided by direct lending, especially when high, floating-rate yields exceed public market alternatives during times of inflation or rate-hike cycles.
Within the broader financial system, private credit fills the lending gaps left by banks while providing diversification with higher, floating rate yields for investors. It’s longer investment horizon and flexible capital allow it to stay active in the market when banks may retreat, providing a durable source of funding.
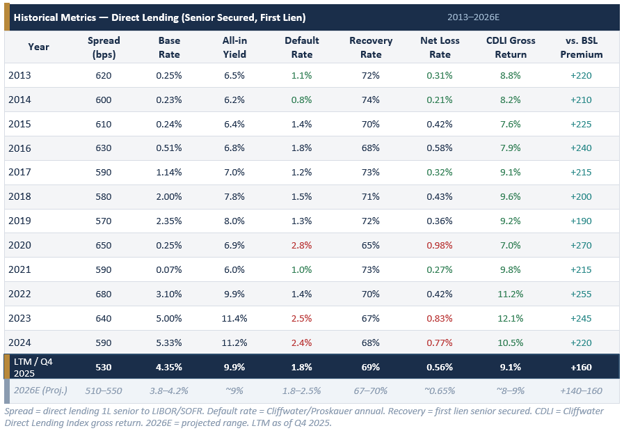
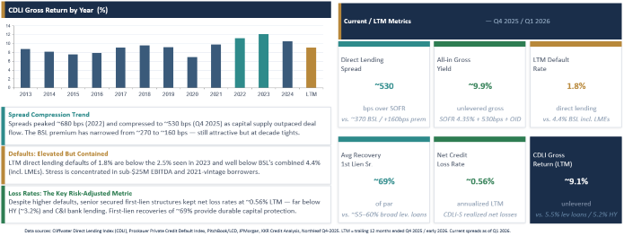
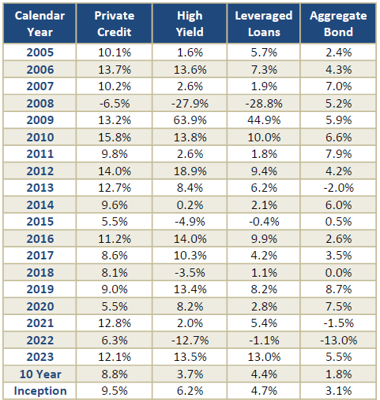
Private Credit spreads, credit performance, and returns have stood the test of time thus far as you can see in the table below:
Key Features of Private Credit - Fund Vehicles
There are four types of private credit in the modern direct lending ecosystem: BDCs, hedge funds, interval funds, and CLOs. Each structure has distinct liquidity, risk, and return profiles.
Private Funds are traditional drawdown structures with long-term lock ups and are the largest segment of the direct lending market by AUM. They are best positioned for the ‘long game’ because capital is locked so managers are not forced to sell and can navigate the market. They typically have modest fund-level leverage with fees including a management fee and performance carry.
Business Development Companies (BDC) are closed-end investment vehicles that provide financing for small and middle-market U.S. businesses. They are operating companies that use higher leverage (up to 2.0x) to maximize yield. Manager selection is critical because top-tier managers like Blackstone, Blue Owl, or Apollo maintain stable NAVs, while smaller mid-market BDCs are experiencing more lumpy credit issues. These funds feature daily liquidity (exchange-traded) with no gate, but NAV can trade at a discount. This could be anywhere from 85-105% of NAV, with the discount widening in stress periods.
Collateralized Loan Obligations (CLO) are backed by pools of loans from private small- to mid-sized companies to create tiered tranches of risk. They are the primary securitization tool for direct lenders. Most 2024-2025 vintage CLOs remain in their reinvestment period, allowing managers to trade out of stressed names and maintain par. These private loans are packaged into tranches so investors can choose their risk-return profile. Lenders earn the spread between the cost of the CLO debt and the interest from the private debt loans.
Interval Funds are hybrid vehicles offering periodic liquidity with much more conservative leverage, typically less than 0.5x. As the leaders of transparency, quarterly SEC filings provide the most honest real-time valuations of these funds. Q1 2026 saw record redemption requests at some large funds, which is a live liquidity stress event worth monitoring. They typically have quarterly liquidity at 5-25% of NAV that can be gated at manager discretion. This gating risk is important to keep in mind, especially in times of stress when redemptions are harder to manage. Most are priced daily and feature low investment minimums as well as 1099 tax reporting which makes them accessible to retail investors.
Key Features of Private Credit Fund Vehicles – Size Comparison
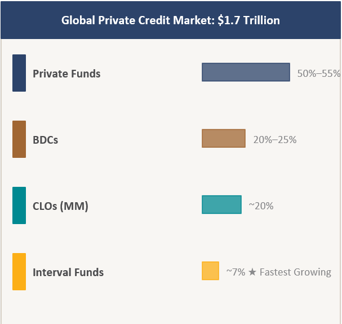
The vast majority of private credit AUM lies in these four fund vehicles and you can see in the table to the right, that private funds are the largest of the four. BDCs are the second largest at around $500 billion but BDCs are divided into traded (roughly $175 billion) and non-traded (roughly $325 billion). Interval funds, on the other hand, represent a relatively small but fast growing segment of the private credit space at just 7%.
Key Features of Private Credit Fund Vehicles – Structure Comparison
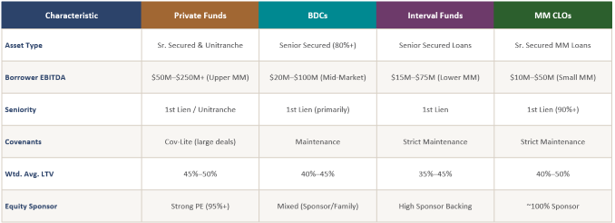
The different structures between private credit vehicles provide investors with different risk and return options. For example, EBITDA (Earnings Before Interest, Taxes, Depreciation, and Amortization) measures a company’s operational profitability and cash flow potential. Choosing private funds where the borrowers have higher EBITDA can be a more stable and resilient option. For interval funds, senior secured debt means being the first in line for repayment rights on company collateral, but this structure can also be less liquid than others. Each structure has its own characteristics, and investors have to consider all options to choose what is best for their portfolio.
Private Credit – Credit Performance History
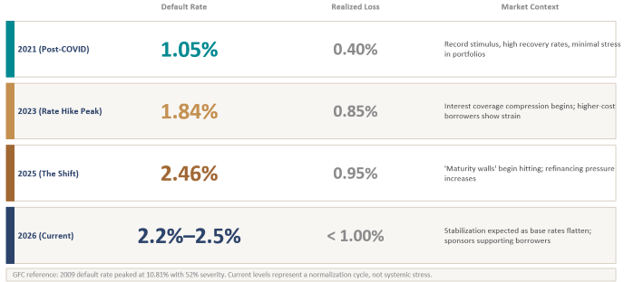
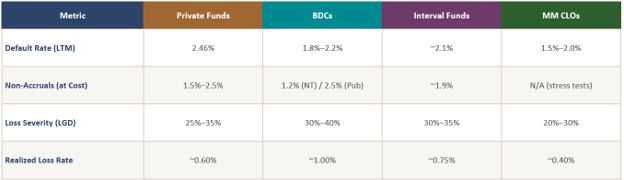
Private Credit – Recent Credit Performance History
Conclusion & Takeaways
Private credit has grown into a crucial part of modern financial markets, driven by regulatory shifts that constrained traditional bank lending after the Global Financial Crisis. By offering floating-rate, senior secured loans, private credit providers have filled a financing gap for mid-sized companies while delivering attractive yields for investors, particularly in rising interest rate environments. As private credit further cements its role as a primary source of corporate financing, it will be essential to balance opportunity with prudent risk management for long-term stability and sustainability.
Private Credit is not monolithic. Between interval funds, BDCs, drawdown funds, and CLOs each carry distinct liquidity, risk, and return profiles, structure matters as much as strategy.
Collateral quality and covenants are paramount. First lien, senior secured loans to PE-backed borrowers with strict maintenance covenants represent the most defensible part of the spectrum. Covenant-lite BSL is a different risk entirely.
Redemption features are structural, not a crisis signal. Gating events are mechanisms designed to protect remaining investors by limiting access. Over 21 years, CDLI cash flow has averaged 8.4% per quarter - well above the 5% redemption cap.
Manager selection may be the single largest risk variable. Annual performance dispersion between top and bottom private debt managers spans 13+ percentage points. The risk in fund selection likely exceeds the risk in the asset class itself. Diversification and due diligence are essential.
The asset class has proven its resilience. Private debt returned +5% annualized through the GFC and +6% through COVID - outperforming public loans and stocks in both cases. CDLI returned 9.27% in 2025 vs. 5.90% for public loans.